Tosoh
FCR AFFINITY CHROMATOGRAPHY - A NEW APPROACH TO ASSESS GLYCAN PROFILES DURING CELL LINE SCREENING AND UPSTREAM DEVELOPMENT
FCR AFFINITY CHROMATOGRAPHY - A NEW APPROACH TO ASSESS GLYCAN PROFILES DURING CELL LINE SCREENING AND UPSTREAM DEVELOPMENT
Description
Fc-glycans of therapeutic antibodies are known to play an important role in the recognition of antibodies by the FcγIIIa receptor. Accordingly, Fc receptor affinity-based separation is also correlated to the N-glycan profile. The TSKgel® FcR-IIIA-NPR affinity chromatography column uses an Fc receptor modified by site-directed mutagenesis to create a ligand with greater stability.
A thirty-minute analysis (Figure 1) gives valuable first information on the distribution of glycoforms and expected ADCC (antibody-dependent cell-mediated cytotoxicity) of analyzed mAb samples. This fast and efficient method can be applied to purified samples and supernatant alike and can therefore be used in many phases of development and production: cell line screening in early R&D, biosimilar/ originator comparison, upstream development and optimization, monitoring of glycoengineering, or lot-to-lot comparison in QC.
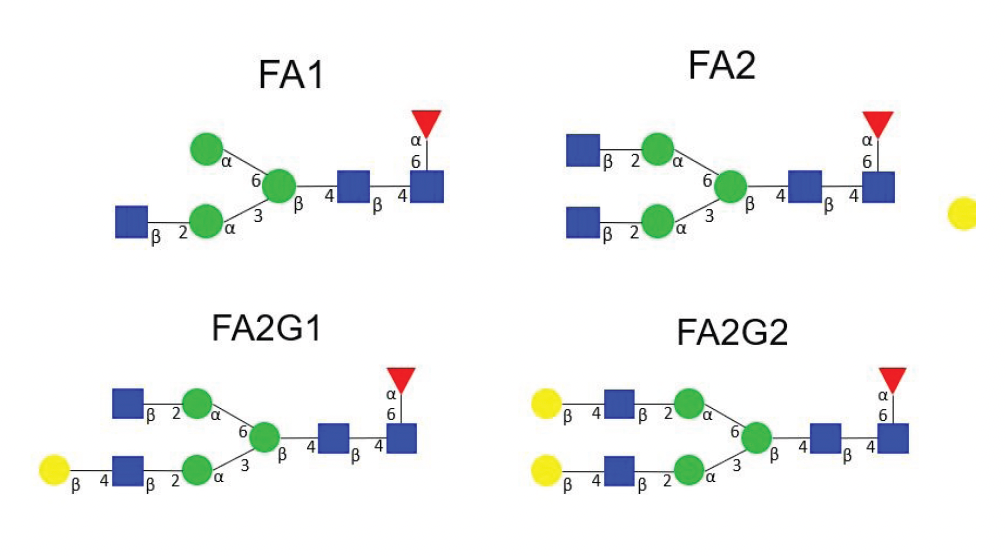
This application note discusses the correlation of TSKgel FcR-IIIA-NPR elution profiles and mAb glycan structures determined by hydrophilic interaction liquid chromatography (HILIC) during a monoclonal antibody upstream process optimization. The glycan profiles that are mentioned throughout this application note are shown in Figure 2.
CORRELATION OF GLYCAN PROFILES WITH FCR AFFINITY PROFILES FOR PURIFIED AND UNPURIFIED SAMPLES
An avantage of TSKgel FcR-IIIA-NPR (P/N 0023513) is, that it requires no specific sample preparation and can be applied to clarified cell culture supernatant and purified protein alike. Table 1 shows the relative area of each peak of the FcR chromatogram for an antibody in cell culture supernatant and for the Protein A purified target. The relative peak areas are very similar for both samples (raw samples versus purified antibody). Only peak 3 shows a higher deviation which is related to the small peak area and variation of the peak integration.
In order to evaluate the potential of FcR affinity chromatography to predict glycan pattern, the glycan species determined by conventional HILIC glycan profiling were correlated with the results of FcR affinity chromatography for three different lots of an originator-drug.
